6.7. TSAR: Tool for Sensitivity Analysis of Reactivity Responses
M. L. Williams and M. A. Jessee
ABSTRACT
TSAR (Tool for Sensitivity Analysis of Reactivity Responses) is a SCALE functional module that computes nuclear data sensitivity coefficients for eigenvalue-difference responses such as reactor reactivity and worth coefficients. Examples include void reactivity, Doppler coefficients, and control rod worths. TSAR reads previously computed sensitivity coefficients for the k-eigenvalues at two states of a reactor system (or for two different systems) and combines them to obtain sensitivity coefficients for the difference. The k-eigenvalue sensitivities are typically obtained using the TSUNAMI-3D or -1D control sequences in SCALE. The reactivity sensitivity coefficients are combined with nuclear data covariance information to determine the uncertainty in the reactivity response.
ACKNOWLEDGMENT
Development of the TSAR code was funded by the U. S. Nuclear Regulatory Commission Office of Research.
6.7.1. Introduction
The TSUNAMI-1D, -2D, or -3D control sequences in SCALE compute multigroup sensitivity coefficients and uncertainties for the critical multiplication factor k, the reciprocal of the \(\lambda\)-eigenvalue of the neutron transport equation for a multiplying medium. The TSAR module in SCALE performs sensitivity/uncertainty (S/U) calculations for responses represented by the difference of two eigenvalues. These types of responses are often of interest in reactor physics applications. For example, TSAR can compute data sensitivities and uncertainties of reactivity responses such as control rod worths, fuel and moderator temperature coefficients, and void coefficients for two defined states of a power reactor [TSARWGC06]. Another potential application is in the analysis of benchmark critical experiments for nuclear data testing and validation studies. Data and methods deficiencies can introduce a computational bias manifested as a trend in calculated critical eigenvalues versus experiment parameters. TSAR can be applied to the difference in the computed eigenvalues of two benchmarks to establish the sensitivity of the bias trend to various nuclear data used in the calculations.
TSAR builds upon capabilities of other SCALE modules. TSUNAMI is first used to calculate sensitivities for the multiplication factors of the reference and altered states of the reactor, respectively. TSAR reads the sensitivity data files (.sdf file) produced by TSUNAMI keff calculations and uses them to compute relative or absolute sensitivities of an eigenvalue-difference response. The reactivity sensitivities are written to an output file for subsequent applications or visualization. TSAR also combines the calculated reactivity sensitivity coefficients with input nuclear data covariance matrices included in SCALE to determine the uncertainty of the reactivity response.
6.7.2. Methodology
A detailed description of the S/U methodology for reactivity responses is given in Reference D D; thus, only a brief overview is presented here. The lambda-eigenvalue form of the neutron transport equation for a multiplying medium is given by
where L and P are the loss and production operators, respectively, for the Boltzmann equation describing a multiplying medium and \(\lambda =\frac{1}{k}\) is the fundamental lambda-eigenvalue. It is assumed that the system is initially in a well-defined state 1 having a lambda- eigenvalue of \(\lambda\)1. The reactivity for state 1 is defined as \({{\rho }_{\text{1}}}\ =\ \text{1}\,-{{\lambda }_{\text{1}}}\) . Suppose that changes in L and/or P transformed the original system into a new distinct configuration designated as state 2, with the lambda eigenvalue of \(\lambda\)2 and static reactivity of \(\rho_{2}=1-\lambda_{2}\). For example, the configuration change could be caused by moving a control rod or by voiding of the coolant. The reactivity insertion/withdrawal associated with the designated change in conditions is defined as
Eq. (6.7.2) defines the eigenvalue-difference (i.e., reactivity) response addressed by TSAR. The code edits the eigenvalues for the two reactor states and the value of the reactivity obtained from Eq. (6.7.2).
6.7.2.1. Reactivity sensitivity coefficients
The relative k-sensitivity coefficient for an arbitrary data parameter \(\alpha\) appearing in the transport equation is equal to
An analogous expression defines the relative sensitivity coefficient of the reactivity response:
Unlike the multiplication factor, the reactivity response can be negative. This can be source of confusion when interpreting the relative sensitivity coefficient; hence, by convention TSAR defines sensitivities relative to the absolute value of the reactivity; thus,
In this way, a positive value for the relative sensitivity coefficient means that increasing the value of \(\alpha\) always increases the value of the reactivity (i.e., a positive :math:` ho` becomes more positive, and a negative :math:` ho` becomes less negative). Conversely, a negative relative sensitivity coefficient means that increasing \(\alpha\) always decreases the reactivity (i.e., a positive :math:` ho` becomes less positive, and a negative :math:` ho` becomes more negative). This convention is used in TSAR for all relative quantities involving the reactivity.
From the definitions in Eq. (6.7.2) and Eq. (6.7.3), Eq. (6.7.4) is simplified to the following expression used in TSAR:
where \(\text{S}_{\text{k1,}\alpha }^{{}}\) and \(\text{S}_{\text{k2,}\alpha}^{{}}\) are the k-sensitivities for the two states. The relative change in the reactivity response due to an arbitrary relative variation (or uncertainty) in parameter \(\alpha\) can be found very easily once the :math:` ho`-sensitivities are determined that is,
In cases where the net reactivity change is very small, the denominator of Eq. (6.7.6) approaches zero; thus, the relative sensitivity coefficient can increase without bound. For this reason TSAR provides an input option to compute UabsoluteU rather than UrelativeU sensitivity coefficients. Absolute quantities are indicated here by the presence of a tilde (~), while relative quantities have no tilde. The absolute sensitivity coefficient is defined in TSAR as the absolute change in the reactivity, expressed in pcm (percent-milli), due to a fractional change in data:
so that
Prior to executing TSAR, it is necessary to perform TSUNAMI calculations for each reactor state, in order to evaluate the relative k-sensitivity coefficients in Eq. (6.7.3). These are written out in the SDF sensitivity file format and saved for input to TSAR. TSAR reads the two previously prepared files and uses them to evaluate Eq. (6.7.6) or Eq. (6.7.8) for the reactivity sensitivities. The :math:` ho`-sensitivities are then output to another SDF file. As discussed in Sect. 6.1 of the SCALE documentation, the complete sensitivities calculated by TSUNAMI include implicit effects associated with perturbations in resonance self-shielding; hence, the reactivity sensitivities also account for these effects, which can be significant.
TSAR prints the number of different sensitivity profiles that are computed and optionally can edit the input k-sensitivities corresponding to each reactor state, as well the calculated :math:` ho`-sensitivities. Sensitivities may be edited by a sum over group for each nuclide-reaction pair. In addition, the TSAR output SDF file containing multigroup :math:` ho`-sensitivities for each nuclide-reaction pair can be read by Fulcrum to produce plots of the energy-dependent sensitivities. The filename of the reactivity sensitivity data file is given as job_name.react.sdf, where job_name is the name of the TSAR input file (i.e., job_name.inp, job_name.input, or simply job_name). Additionally, if the user requests edits of the input k-sensitivities using the print=all option, the k-sensitivity data files are copied to the return directory as job_name.kstate1.sdf and job_name.kstate2.sdf. The print keyword is further described in the TSAR input section.
6.7.2.2. Reactivity uncertainty analysis
TSAR performs uncertainty analysis for eigenvalue-difference responses in much the same manner as the TSUNAMI sequences for the multiplication factor, except that either absolute or relative uncertainties may be computed. Assume that the transport calculations for the eigenvalues of the two reactor states use “N” input parameters, consisting of nuclear data for all groups, reaction types, and nuclides. The relative sensitivity coefficients for these data can be expressed as components of the N-dimension column vector \(\mathbf{S}_{\rho }^{{}}\) and similarly for the absolute sensitivities \(\mathbf{S}_{\rho }^{{}}\). The relative and absolute reactivity variances-indicated as \(\sigma _{\rho}^{\text{2}}\) and \(\sigma _{\rho }^{\text{2}}\), respectively-are calculated in TSAR as
where \(\mathbf{C}_{\boldsymbol{a} \boldsymbol{a}}\)
is the relative covariance matrix describing nuclear data uncertainties and correlations, which are read from the SCALE covariance libraries. Due to the manner in which the absolute sensitivity coefficient is defined in Eq. (6.4.8), the absolute variance of the reactivity still uses the relative covariance matrix of the nuclear data.
The reactivity variance is related to the uncertainties and correlations in the calculated eigenvalues of the two reactor states. It can be shown that expression in Eq. (6.7.10) for the relative variance in an eigenvalue-difference response is equivalent to
In the above equations, \(\sigma _{\text{k1}}^{{}}\) and \(\sigma _{\text{k2}}^{{}}\) are relative standard deviations of the multiplication factors and the correlation coefficient between the two reactor states is designated as \(c_{1 \rightarrow 2} \in[-1,1]\). The eigenvalue calculations of the two states are correlated because they both use the same nuclear data libraries; therefore, the variance in the eigenvalue-difference is not simply the sum of the variances of the eigenvalues. A positive correlation (i.e., \(c_{1 \rightarrow 2}>0\)) reduces the uncertainty in the reactivity because common uncertainties tend to cancel from the eigenvalue difference. On the other hand, negative correlations increase the reactivity uncertainty. It also can be seen from Eq. (6.7.11). that whenever the difference in the eigenvalues of the two states is small, the relative variance of the reactivity is substantially greater than the individual eigenvalue variances because the coefficients of \(\sigma _{\text{k1}}^{\text{2}}\) and \(\sigma _{\text{k2}}^{\text{2}}\) are large. Since this is usually the case for reactivity changes in a reactor, relative uncertainties in reactivity responses tend to be much larger than those for eigenvalues. If the reactivity response is close to zero, it is usually preferable to consider absolute rather than relative uncertainties. Whenever the eigenvalue difference is less than 10-10, TSAR will abort the calculation if a relative uncertainty is specified.
TSAR calculates the variance in the reactivity response using the expressions in Eq. (6.7.10). The square root of the variance corresponds to the standard deviation, which indicates the reactivity uncertainty. TSAR edits this value, as well the individual contributions of each nuclide-reaction pair (including cross correlations) to the overall uncertainty.
6.7.2.3. Cross-section-covariance data
The cross-section-covariance data are read from the COVERX-formatted covariance library identified by coverx= in the PARAMETER data block on the TSAR input file. Cross-section-covariance data files distributed with SCALE are discussed in Sect. 10.3, and the format of the COVERX data file is presented in Sect. 6.3.4.1.6. The recommended SCALE covariance libraries include uncertainty data for all materials in ENDF/B-VII. These data were obtained from a variety of sources, including ENDF/B-VI and VII, JENDL, and approximate values based on uncertainties in measured integral parameters. [TSARWR08]. The COVARIANCE data block can be used to override and/or supplement the library uncertainty values for specified nuclide-reaction pairs. The keyword use_icov is entered in the PARAMETER data block to utilize the covariance data defined in the COVARIANCE data block. Additionally, a default uniform standard deviation value can be assigned for any missing covariance data. This default value is defined by the udcov= keyword in the PARAMETER data block, and the keyword use_dcov is entered to activate the option. Warning messages are printed to identify substituted covariance matrices.
When use_dcov and/or use_icov and cov_fix are specified in the PARAMETER data block, and a reaction has zero or large (standard deviation > 1000%) values on the diagonal of the covariance matrix, the diagonal elements and off-diagonal terms are replaced according to the user-input criteria. Warning messages are printed to identify the replaced values. Additional options for user-specified covariance data are given in Sect. 6.7.3.2.
In the reactivity-uncertainty-analysis edit, a single asterisk (“*”) identifies uncertainty contributions from nuclide-reaction pairs for which the default cross-section-covariance data is applied. Likewise, the markers (“**”), (“*”), (“**”), denote (a) user-input covariance data, (b) covariance library data replaced by default values, and (c) covariance library data replaced by user-input values, respectively. In the HTML output, these uncertainty contributions are distinguished by using unique HTML colors. The different HTML colors are specified by the HTML block keywords ud_clr=, ui_clr=, udfix_clr=, and uifix_clr=. The HTML block keyword options are discussed in more detail in Sect. 6.7.3.3.
TSAR computes a problem-specific covariance library that contains cross-section covariances only for the nuclide-reaction pairs (including cross correlations) listed on the k1-and k2-sensitivity data files. This covariance library, referred to as the working covariance library, is written in COVERX format like the SCALE covariance library. The working covariance library contains any default or user-input covariance data for nuclide-reaction pairs that were not on the input covariance library as well as any modified cross-section-covariance data. The working covariance library can be read by the Javapeño plotting tool to visualize the cross-section-covariance data used in the reactivity uncertainty analysis.
6.7.3. Input Description
The user input for TSAR consists of a SCALE Analytic Sequence Specification Record (i.e., =tsar), an optional title followed by three blocks of data in free-form keyword format, and a SCALE input termination END record. The data blocks begin with READ KEYNAMEand end with END KEYNAME, where KEYNAME is the name of an individual data block. The PARAMETER data block is the only required block of data, while the HTML and COVARIANCE data blocks are optional. The data blocks can be entered in any order.
6.7.3.1. Parameter data
The PARAMETER block of data is used to specify the name of the previously prepared k-sensitivity data files, the name of the :math:` ho`-sensitivity data file, and other keyword options that control the code execution. The keyword options are listed in Table 6.7.1 along with their default values and description. A keyword that ends with “=” must be followed by additional data. Keywords that do not end with “=” are Boolean flags that are used to turn on certain features of the code, such as the computation of certain data or certain output edits. If the keyword is present for a Boolean entry, the value is set to true. Otherwise, the value is set to false.
Keyword |
Default value |
Description |
|---|---|---|
cov_fix (optional) |
False |
Replace zero and large (standard deviation > large_cov) values on diagonal of cross-section-covariance data with user-input values or default values. |
coverx= (optional) |
44groupcov |
Name of cross-section-covariance data file to use in analysis. |
large_cov= (optional) |
10.0 |
Cutoff fractional standard deviation value for cov_fix. Covariance data with uncertainties larger than large_cov are replaced with user-defined or default values. Default =10, which is 1000% uncertainty. |
nocovar (optional) |
False |
If nocovar is present, the reactivity uncertainty calculation is bypassed. |
(optional) |
False |
If |
(optional) |
rho |
Available options are
|
return_work_cov (optional) |
False |
If return_work_cov is present, the working covariance library is copied to the return directory with the file name job_name.wrk.cov, where job_name is the name of the input file. If return_work_cov is not present, the working covariance library remains in the temporary working directory with the file name job_name.wrk. |
sdf_file_1= (required) |
n/a |
The file name of the initial state k1-sensitivity data file. |
sdf_file_2= (required) |
n/a |
The file name of the final state k2-sensitivity data file. |
type= (optional) |
relative |
Available options are
relative (or rel)
and absolute (or
abs). If
type=relative, the
output reactivity
sensitivity data file
contains relative
\(rho-\)sensitivities. If
|
udcov= (optional) |
0.05 |
User-defined default value of standard deviation in cross-section data to use for all groups for nuclide-reaction pairs for which cross section covariance data are too large or not available on the input covariance library. |
udcov_corr= (optional) |
1.0 |
User-defined default correlation value to use for nuclide-reaction pairs for which cross section covariance data are not available on the input covariance library. |
udcov_corr_type= (optional) |
zone |
User-defined default correlation in cross-section data to use for nuclide-reaction pairs for which cross-section covariance data are not available on the input SCALE covariance library. Allowed values are long, zone, and short. See Table 6.7.2 for details on long, zone, and short. |
udcov_therm= (optional) |
0.0 |
User-defined default value of standard deviation in cross-section data to use for thermal data for nuclide-reaction pairs for which cross-section covariance data are too large or not available on the input covariance library. If input, the udcov_therm value overrides the udcov value in the thermal range (i.e., neutron energies below 0.625 eV). |
udcov_inter= (optional) |
0.0 |
User-defined default value of standard deviation in cross-section data to use for intermediate data for nuclide-reaction pairs for which cross section covariance data are too large or not available on the input covariance library. If input, the udcov_inter value overrides the udcov value in the intermediate range (i.e., neutron energies above 0.625 eV and below 25 keV). |
udcov_fast= (optional) |
0.0 |
User-defined default value of standard deviation in cross-section data to use for fast data for nuclide-reaction pairs for which cross section covariance data are too large or not available on the input covariance library. If input, the udcov_fast value overrides the udcov value in the fast range (i.e., neutron energies above 25 keV). |
use_dcov (optional) |
False |
Use user-defined default cross-section covariance data for nuclide-reaction pairs not included on the input covariance library. |
use_icov (optional) |
False |
Use user-defined cross section covarianc data input in the COVARIANCE input data block in place of the default values for user-input nuclide-reaction pairs that are not on the input covariance library. |
6.7.3.2. User-input covariance data
The COVARIANCE data block described in Table 6.7.2 allows the user to specify a covariance matrix for specific nuclide-reaction pairs for which covariance data are not present on the input covariance library or that have zero or large values on the diagonal. The COVARIANCE data block must begin with READ COVARIANCE and end with END COVARIANCE.
Input parameter |
Requirement |
Default value |
Allowed values |
Description |
|---|---|---|---|---|
Nuclide |
Required |
none |
Nuclide name or ZA number |
Nuclide for which covariance data are to be entered |
Reaction |
Required |
none |
Reaction name or ZA number |
Reaction for which covariance data are to be entered. See the TSUNAMI-IP manual for available reaction types. |
all= |
Optional |
0.0 |
any number |
Fractional standard deviation value to be applied to all groups |
fast= |
Optional |
0.0 |
any number |
Fractional standard deviation value to be applied to fast groups. If input, the fast value overrides the all value in the fast range (i.e., neutron energies above 25 keV). |
therm= |
Optional |
0.0 |
any number |
Fractional standard deviation value to be applied to thermal groups. If input, the therm value overrides the all value in the thermal range (i.e., neutron energies below 0.625 eV). |
inter= |
Optional |
0.0 |
any number |
Fractional standard deviation value to be applied to intermediate groups. If input, the inter value overrides the all value in the intermediate range (i.e., neutron energies above 0.625 eV and below 25 keV). |
corr= |
Optional |
1.0 |
any number from -1.0 to 1.0 |
Correlation between groups |
corr_type= |
Optional |
zone |
long, short, zone |
Type of correlation applied from group-to-group covariance values long - correlation is applied between all groups short - correlation is applied only between adjacent groups zone - correlation is applied within fast, intermediate, and thermal groups, but no correlation is applied between zones |
end |
Required |
Denotes end of input for current nuclide/reaction |
Any MT number or reaction name will be treated as a valid input, but only those present on the k1- or k2-sensitivity data files will impact the results. The reaction sensitivity types computed by SAMS from TSUNAMI-1D and TSUNAMI-3D are described in the TSUNAMI-IP manual. An energy-covariance matrix is created for the specified nuclide-reaction pair with the square of the entered standard deviation for the diagonal terms for all groups using the all= value. Groups in the fast, intermediate, and thermal energies are then set to the square of the standard deviation value entered for fast=, inter=, and therm=, respectively. The off-diagonal terms of the energy matrix are generated according to the input for corr=, and corr_type=, with default settings of 1.0 and zone. Data entered in this block are used only for missing data and do not override values on the input covariance data file. The SCALE 5.1 input format is supported where data are entered in triplets with the nuclide name (e.g., u-235), then the reaction MT number or name (e.g., 18 or fission), and then a standard deviation value. In this case, the end keyword must not be entered. The standard deviation value is applied to all groups with default setting for correlations. These data are only used if use_icov is specified in the PARAMETER data block. When both use_icov and cov_fix are specified in the PARAMETER data block, and a reaction has zero or large (standard deviation > 1000%) values on the diagonal of the covariance matrix, these values are replaced with the square of the user input standard deviation value, and the corresponding off-diagonal terms are substituted according to the values of corr and corr_type.
6.7.3.3. HTML data
The optional HTML data block is used to customize HTML-formatted output. The HTML data block must begin with READ HTML and end with END HTML. The data input to the HTML data block consists of several keywords that are shown, along with their default values and descriptions, in Table 6.7.3. A keyword that ends with “=” must be followed by text data. For color entries, any valid html color name can be entered or the hexadecimal representation can be used if preceded by a # sign. For example, to change the background color of the html output to white, bg_clr=white and bg_clr=#ffffff have the same effect, because ffffff is the hexadecimal representation of white. An extensive list of available colors for customized output is shown in Sect. 6.3.4.1.7. Please note that not all features are supported by all browsers.
Keyword |
Default value |
Description |
bg_clr= |
papayawhip |
Background color |
h1_clr= |
maroon |
Color used for major headings |
h2_clr= |
navy |
Color used for sub-headings |
txt_clr= |
black |
Color for plain text |
lnk_clr= |
navy |
Color for hyperlinks |
lnk_dec= |
none |
Decoration for hyperlinks. (none, underline, overline, line-through, blink) |
vlnk_clr |
navy |
Color for visited hyperlinks |
ud_clr= |
blue |
Color for values in tables that use default covariance data |
ui_clr= |
red |
Color for values in tables that use user-input covariance data |
udfix_clr= |
royalblue |
Color for values in tables that use default corrected covariance data |
uifix_clr= |
green |
Color for values in tables that use user-input corrected covariance data |
6.7.4. Sample Problem and Output Description
6.7.4.1. Input and text output
An example of TSAR input is given in Example 6.7.1 Each section of the text output, not shown, is described in order below.
Input Listing and Summary of Calculations - The TSAR input data is printed for each data block. Both user-specified and default values for the various keywords are edited.
k1-Sensitivity Data File Summary and Sensitivity Coefficients — The header information for the k1-sensitivity data files follows the input data. This includes the title on the sensitivity data file, the number of energy groups, the number of sensitivity profiles, and the values of k1 and \(\lambda_1\). If
print=allis specified in the PARAMETER data block, the energy, region, and mixture-integrated k1-sensitivity coefficients are edited for each nuclide-reaction pair.k2-Sensitivity Data File Summary and Sensitivity Coefficients — The header information for the k2-sensitivity data files follows the k1-sensitivity data file edit. This includes the title on the sensitivity data file, the number of energy groups, the number of sensitivity profiles, and the values of k2 and \(\lambda_1\). If print=all is specified in the PARAMETER data block, the energy, region, and mixture-integrated k2-sensitivity coefficients are edited for each nuclide-reaction pair.
Reactivity Value and Optional \(\rho\)-Sensitivity Coefficients — After the k1 and k2 sensitivity edits, the reactivity between the two states is edited in pcm units. If print=all or print=rho is specified in the PARAMETER data block, the energy, region, and mixture-integrated \(\rho\)-sensitivity coefficients are edited for each nuclide-reaction pair.
Reactivity Uncertainty Analysis — Following the edit of the reactivity value and the optional \(\rho\)-sensitivity edit, the reactivity uncertainty analysis is printed on the text output. First, a message is printed that states that the working covariance library is being generated. If PARAMETER block keywords
use_dcov,use_icov, and/orcov_fixare specified, covariance warnings are printed whenever user-input covariance data are included in the reactivity uncertainty analysis. Following the covariance warnings, the total reactivity uncertainty is printed along with the reactivity uncertainty contributions from individual energy covariance matrices. The reactivity uncertainty contributions are sorted in descending order.
=shell
  cp $SCALE/output/tsunami-1d1.sdf .
  cp $SCALE/output/tsunami-1d1_147HtoU.sdf .
end
=tsar
tsar example problem
read parameter
  sdf_file_1=tsunami-1d1.sdf
  sdf_file_2=tsunami-1d1_147HtoU.sdf
  use_dcov
  use_icov
  cov_fix
  print=all
  udcov_fast=0.10
  udcov_inter=0.15
  udcov_therm=0.08
  udcov_corr_type=zone
  udcov_corr=1.0
  return_work_cov
end parameter
read html
 bg_clr=Aliceblue
 ud_clr=blue
 ui_clr=read
 udfix_clr=green
 uifix_clr=darkorange
end html
end
6.7.5. HTML Output
The input file for the TSAR sample problem shown in Example 6.7.1 is named tsar1.input. In this case, the HTML-formatted output is stored in a file called tsar1.html and additional resources are stored in directories called tsar1.htmd and applet_resources. This section contains example TSAR HTML-formatted output only for demonstration of the interface. The problem does not correspond to the sample problem distributed with SCALE and is included for illustrative purposes only. When tsar1.html is opened in a web browser, the information shown in Fig. 6.7.1 is displayed.
Fig. 6.7.1 Initial screen from TSAR HTML output.
The title of the input file is displayed between the two SCALE logos. Clicking on the SCALE logo will link the user directly to the SCALE website, if Internet access is available. Because this SCALE input file only executed TSAR, only a single output listing is available. The text “1. TSAR” is a hyperlink to view the output from TSAR. Clicking on the “1. TSAR” hyperlink will bring up the information shown in Fig. 6.7.2.
The initial page of output from TSAR is shown in Fig. 6.7.2. Program verification information is shown in the table under the TSAR logo. This table includes information about the code that was executed and the date and time it was run. The menu on the left side of the screen contains hyperlinks to specific portions of the code output. Echoes of the input data are available in the Input Data section. Any errors or warning messages are available in the Messages sections. Results from the code execution are shown in the results section.
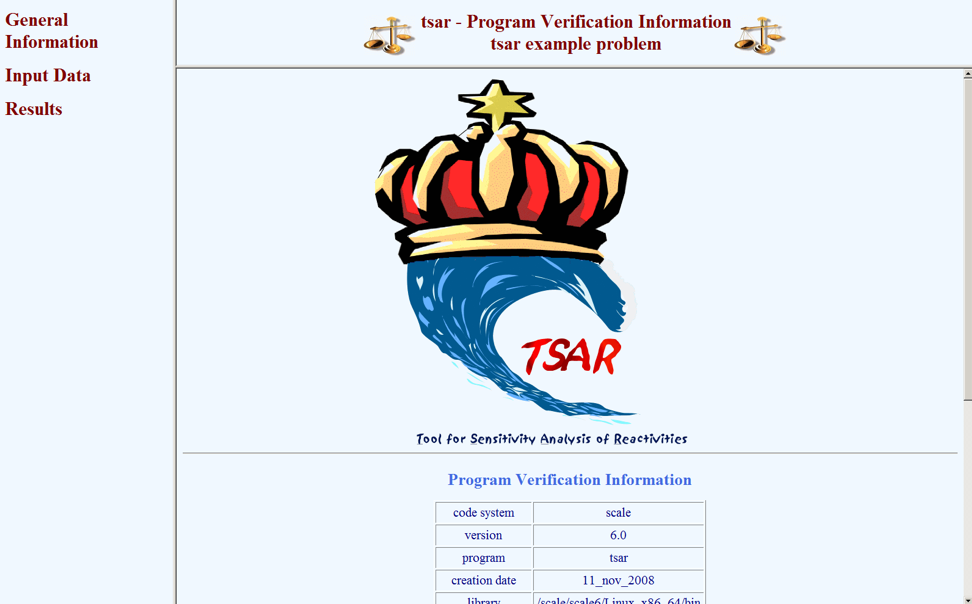
Fig. 6.7.2 Program verification screen from TSAR HTML output.
Selecting Input Parameters will reveal the menu of available input data. Selecting Input Parameters causes the table shown in Fig. 6.7.3 to be displayed. Other input data can also be displayed by selecting the desired data from the menu.
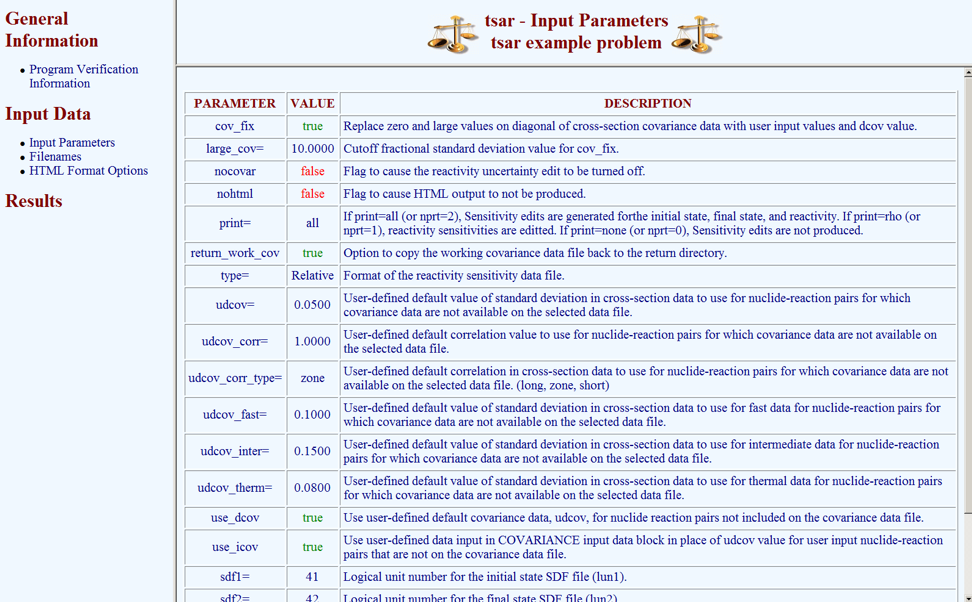
Fig. 6.7.3 Input parameters from TSAR HTML output.
Selecting Results causes a menu of available results to be revealed. From this menu, selecting Reactivity Sensitivities causes a submenu to be revealed. From the submenu, the Reactivity Sensitivities can be visualized in tabular format or plot format. Selecting Energy, Region, and Mixture Integrated Sensitivity Coefficients from this submenu causes the information shown in Fig. 6.7.4 to appear.
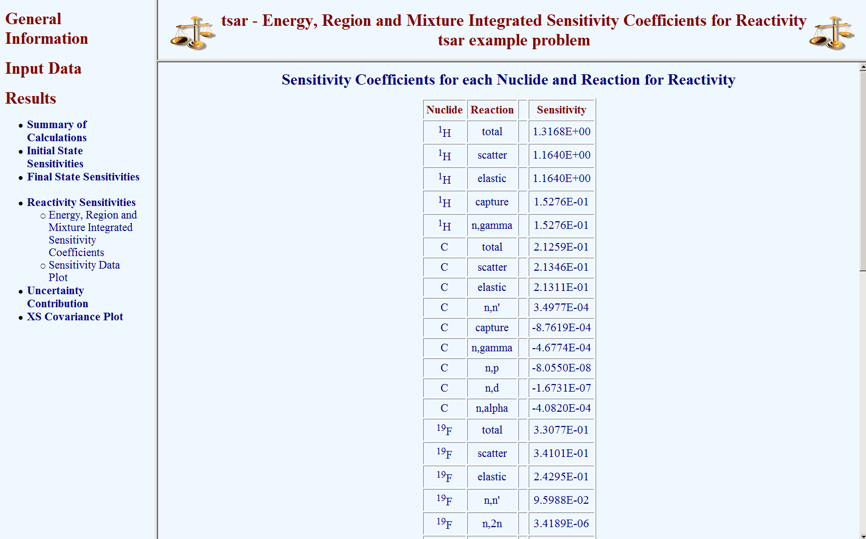
Fig. 6.7.4 Global integral indices from TSAR HTML output.
Plots of sensitivity data from the initial and final states as well as the reactivity sensitivities are available for viewing in the TSAR HTML output. If the return_work_cov keyword option is included in the PARAMETER block on the TSAR input file, then the covariance data can be viewed by selecting “XS Covariance Plot” in the results submenu. A Java applet version of Javapeño will appear in the browser window with the working covariance library preloaded. Data can be added to the plot by double-clicking on the list of available data on the right side of Javapeño. The plot shown in Fig. 6.7.5 was produced with this procedure.
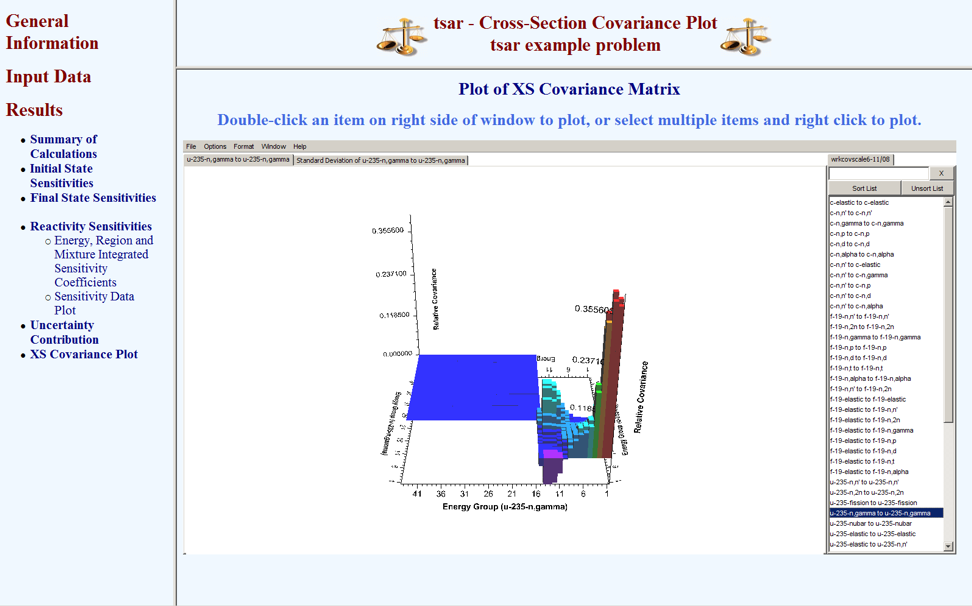
Fig. 6.7.5 Covariance data from TSAR HTML output.
References
- TSARWGC06
Mark L. Williams, Jess C. Gehin, and Kevin T. Clarno. Sensitivity analysis of reactivity responses using one-dimensional discrete ordinates and three-dimensional Monte Carlo methods. In C135. pdf in Proc. of PHYSOR–2006, American Nuclear Society Topical Meeting on Reactor Physics: Advances in Nuclear Analysis and Simulation. 2006.
- TSARWR08
Mark L. Williams and Bradley T. Rearden. SCALE-6 Sensitivity/uncertainty methods and covariance data. Nuclear Data Sheets, 109(12):2796–2800, 2008.